Anthropic’s public filing offers a useful test of how we read an AI business: fast revenue growth, a very large accounting loss, positive operating cash flow and a share structure that separates economic exposure from control. Those facts describe different things. Combining them into one dramatic headline loses much of the story.
This analysis reads the initial Form S-1 dated 26 October 2026, alongside the filing index and company announcement. The offering is proposed. An exact trading date, a final price and a completed IPO valuation are not established by this document.
Prepared 26 October 2026 · Initial S-1 · CIK 2130357 · Accession 0001628280-26-067168. The half-year financial statements are unaudited. Later amendments can change the picture.
What has actually been confirmed
Anthropic’s announcement confirms a proposed Class A offering and intended Nasdaq Global Select Market ticker ANT. It says the share count and price range have not been determined and registration is not yet effective. Its earlier confidential submission was announced on 1 June. Company announcement · June announcement
Filing, effectiveness, pricing and trading are separate milestones. An S-1 gives readers a registration document to examine; it does not mean the SEC has endorsed the investment or that a stock can already be bought on the exchange. The SEC’s IPO investor bulletin explains why the preliminary and final prospectuses must be distinguished.
For this article, the reported prospect of a November debut is a timing expectation to verify in subsequent announcements, rather than a date to stamp onto a countdown. Likewise, the $1.5 trillion and $2 trillion figures examined below are valuation scenarios, not finalized offering terms.
Revenue grew about fourteenfold in the same six months
| Measure | 2025 | 2026 |
|---|---|---|
| Revenue | $1.163 | $16.286 |
| Operating loss | −$2.135 | −$0.693 |
| Net loss | −$12.969 | −$80.748 |
| Operating cash flow | −$1.513 | +$3.929 |
Source: S-1, consolidated statements and MD&A cash-flow table. Figures converted from millions to billions; half-year data is unaudited.
The like-for-like ratio is 16.286 ÷ 1.163 = 14.00×. The percentage increase subtracts the original base: (16.286 − 1.163) ÷ 1.163 × 100 = 1300.3%. Fourteen times the starting value is therefore roughly a 1,300% increase, not a 1,400% increase. Our percentage change calculator uses that same denominator distinction.
Compare the same six-month period
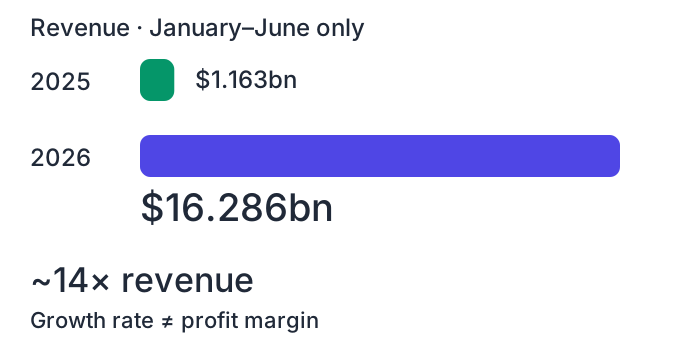
The period matters as much as the arithmetic. Comparing six months with six months avoids turning a partial year into a full-year result. Doubling a half-year number is a mechanical annualization, not evidence of what the second half will deliver. Growth can also change the customer mix, payment timing and capacity required to support the business.
A stronger research question is what makes that revenue repeatable: renewal behavior, customer concentration, distribution terms, capacity availability and the cost of serving incremental usage. The growth ratio by itself cannot answer those questions, and extrapolating it unchanged for several years would add assumptions that are absent from the filing.
The $80.748 billion loss is not an $80.748 billion cash-burn figure
The statement includes a $72.388 billion adverse fair-value change on convertible instruments and related liabilities. The other-expense line is also large. The S-1’s MD&A connects the fair-value change primarily to the higher value of outstanding convertible notes as the company’s valuation increased. These accounting effects must be separated from operating performance and actual cash movements.
Build the accounting loss one line at a time
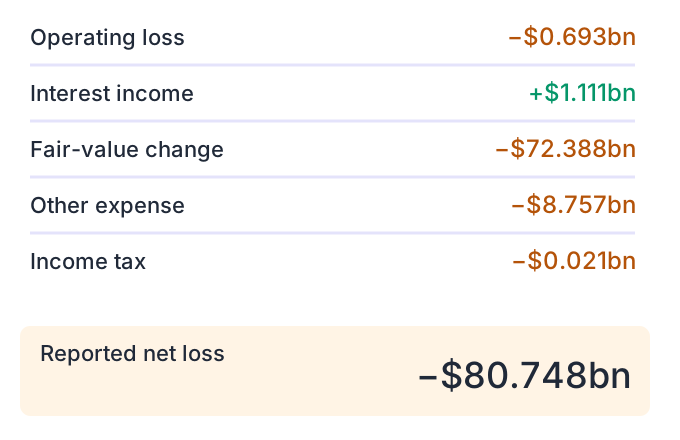
Show the complete net-loss arithmetic
All amounts below are USD billions for January–June 2026.
| Statement line | Signed contribution |
|---|---|
| Operating loss | −$0.693bn |
| Interest income | +$1.111bn |
| Fair-value change | −$72.388bn |
| Other income/expense, net | −$8.757bn |
| Income taxes | −$0.021bn |
| Net loss | −$80.748bn |
Calling an expense noncash does not make it economically irrelevant. A financing instrument can affect future conversion, dilution or obligations even when its remeasurement is not a cash payment in that period. The useful correction is narrower: net loss is not interchangeable with cash burned.
Operating loss answers a different question. Here, dividing −0.693 by 16.286 gives a calculated operating margin of -4.26%. That is much closer to operating break-even than the headline net-loss number suggests, but it is still a loss. It is also a historical snapshot, not a forecast that the next period will cross into profit.
There is another classification trap in the expense table
The main statement groups expenses by their nature. Note 8 also supplies a functional breakdown: first-half 2026 cost of revenue is $2.380 billion and research and development is $9.741 billion. Using the functional cost-of-revenue line gives a calculated gross profit of $13.906 billion, or 85.4% of revenue.
That calculation does not eliminate research spending, selling costs or other operating expenses. Nor should the entire compute-and-infrastructure category be relabeled as cost of revenue: it covers more than customer-serving workloads. Gross margin, operating margin and net margin are different layers. Treating a favorable figure from one layer as the economics of the whole company would miss the costs recorded in the others.
Positive operating cash flow deserves a closer look too
Three different measures, one period
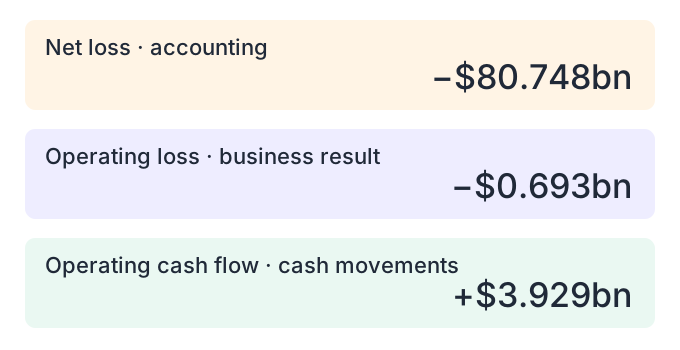
Operating cash flow was positive while the accounting net loss was very large. The S-1 attributes the operating-cash-flow improvement partly to noncash adjustments and working-capital timing. June-end cash and equivalents were $112.389 billion, with $19.262 billion of short-term investments. The sum is $131.651 billion, a calculated total—not revenue or profit.
A cash-flow statement separates operating, investing and financing activity. Customer collections and vendor-payment timing can help or hurt operating cash in a particular period. Raising capital belongs to financing, while buying a short-term investment is an investing cash outflow even though it can be a transfer into another financial asset.
This is why subtracting all investing outflows from operating cash flow and labeling the result “cash burned on AI” would be too crude. It would mix purchases of financial investments with capital spending and other transactions. A defined free-cash-flow calculation needs the relevant capital-expenditure lines and a consistent definition, not a shortcut through the net investing total.
The balance sheet is a dated stock of resources. A cash-flow statement records movements over a period. Neither alone proves that future obligations are comfortably funded. A runway estimate also needs assumptions about future collections, expenses, payment schedules, capital spending and financing; dividing cash by an accounting loss would combine incompatible quantities.
Compute contracts need dates and conditions, not one giant total
The contractual-obligations discussion describes multiyear infrastructure arrangements, including minimum commitments, equipment leases and capacity-dependent payments. It also leaves some aggregate commitment figures blank in this preliminary version. A precise total should not be manufactured by filling those blanks with a headline estimate.
Read each arrangement on four dimensions
- Amount: a minimum, an upper bound, an estimate or a capacity commitment without a fixed dollar sum
- Time: the contract term and the dates on which payments actually begin
- Conditions: delivery, acceptance, deployment, financing or other requirements
- Exit: cancellation windows, breach provisions and amounts that remain payable regardless of usage
Adding a cancellable maximum to a non-cancellable minimum and a lease total can produce an impressive number without a coherent meaning. The terms may cover different periods, exclude interest, depend on future delivery or use different accounting treatment. Even a carefully assembled multiyear total would not be a single-year expense or an amount due immediately.
The economic tension to examine is the duration mismatch: capacity can be reserved years ahead, while customer demand can change more quickly. A high-growth period can absorb committed capacity productively; a slower period can leave less flexibility. That is an analytical question about contract structure, not a prediction that a particular downside will occur.
Buying economic exposure does not mean buying control
The proposed structure gives the Long-Term Benefit Trust a Class T channel to elect a board majority. A Founder LLC’s single Class F share carries 50.1% of general shareholder voting power; public Class A shares receive one vote each. The special Class T and Class F shares have no economic rights. These are different mechanisms, not interchangeable ownership percentages.
Economic shares and voting control are different
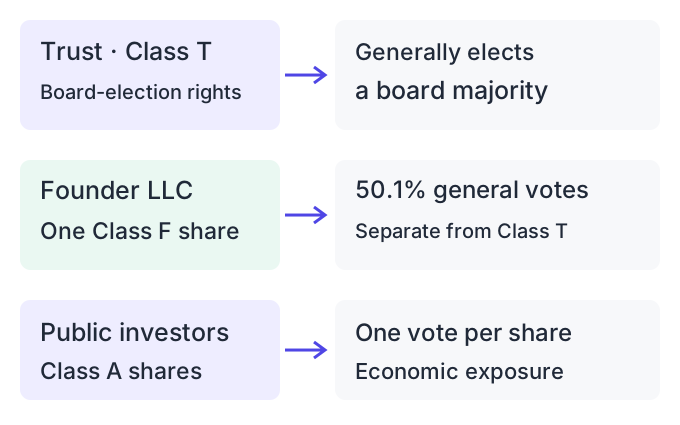
The most important distinction is between a claim on economic outcomes, a vote on general shareholder matters and a right to select directors. A person can hold economic shares without having proportionate influence over all three. In this structure, treating the founders’ 50.1% general vote as 50.1% of the company’s financial ownership would be wrong.
For readers, the question is whether the proposed rights match the bargain they think they are evaluating. Mission-oriented governance can deliberately protect priorities from ordinary shareholder pressure. The same design can limit an outside shareholder’s ability to redirect the company. Explaining both consequences is more useful than calling the structure either automatically good or automatically bad.
A trillion-dollar valuation needs a definition and a denominator
Consider two explicit what-if equity values: $1.5 trillion and $2 trillion. Neither is presented here as a finalized IPO valuation. Twice the disclosed first-half revenue is $32.572 billion. Using that mechanical annualization, the two equity-value-to-revenue ratios are about 46.1× and 61.4×.
Put a denominator under the valuation headline
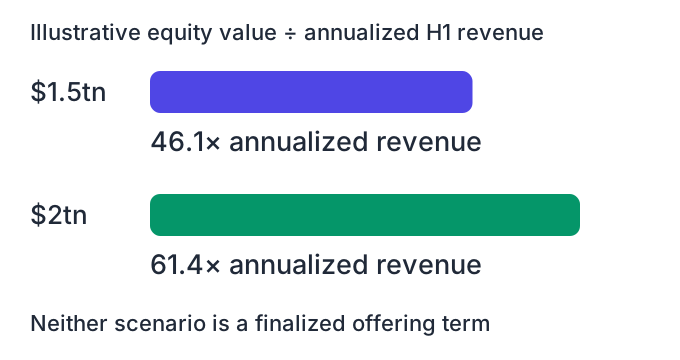
Change the revenue denominator and the story changes. Using full-year 2025 revenue of $4.585 billion instead gives approximately 327.2× and 436.2×. That does not make one result the uniquely correct answer: it shows why the period and whether a number is actual, annualized or forecast must travel with every multiple.
These calculations use equity value. Enterprise value requires an explicitly defined treatment of cash, debt and other claims, so the ratios should not casually be relabeled EV/revenue. Nor is a revenue multiple a forecast of returns. It does not model future margins, dilution, competitive outcomes, the required return or the price eventually paid for a specific class of shares.
An additional ambiguity sits inside the phrase “largest IPO.” Company valuation, gross offering proceeds, net company proceeds and first-day trading value are different rankings. Any record claim must say which measure it uses and compare like with like.
An IPO has two possible money destinations
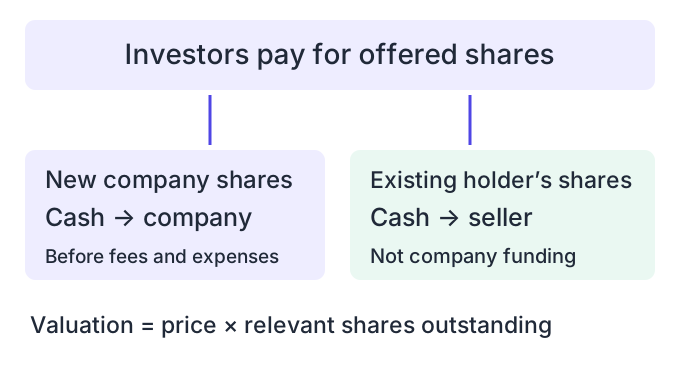
The cover contemplates shares sold by the company and by selling holders; seller proceeds do not go to Anthropic. A large market capitalization can therefore coexist with a much smaller cash injection. New shares can raise cash and change the share count; the relevant pre-offering and post-offering denominators must be kept consistent.
What a useful follow-up should verify
The next article should be triggered by new evidence, not a requirement to make this page appear fresh. A price-range amendment, a final prospectus, a changed financial table or a documented change to share rights would justify a substantive update. A date change without new reporting would not.
- Identify the latest amendment and distinguish it from this initial filing
- Check price, share count, company-versus-selling-holder mix and net proceeds
- Revisit conversion, dilution and the post-offering share denominator
- Compare newly completed quarterly data with the same period a year earlier
- Track updated obligation schedules and material changes to contractual conditions
The useful picture today is layered: revenue has expanded rapidly, the operating result and accounting result differ sharply, cash movements need their own reading, and the proposed voting structure is unusual. None of those observations establishes an IPO purchase price or an investment recommendation. Together, they explain what the first document lets a reader calculate—and what it still leaves open.
Primary sources and research notes
- SEC filing index, 26 October 2026 — issuer identity, filing date and document inventory
- Anthropic, PBC Form S-1 — cover; consolidated financial statements; MD&A; Note 8; contractual obligations; capital structure
- Anthropic’s public S-1 announcement — proposed ticker and offering status
- Anthropic’s confidential-submission announcement, 1 June 2026
- SEC investor bulletin on IPOs — preliminary versus final prospectuses and sections to inspect
Contextual reporting: Associated Press, 26 October 2026, for the reported prospective listing window. Reporting is distinguished from finalized terms in the issuer’s announcement and filing.
Ratios, margin calculations and scenario comparisons are QuickCalculators calculations from the specified inputs. They are analysis, not company guidance. Rounded display values can differ from sums made from the original million-dollar rows. This is an educational document analysis, not a recommendation to buy or sell securities.
Corrections: [email protected]. Include the document version and the relevant table or section.